Open-source CT viewer

Built around how radiologists actually read.

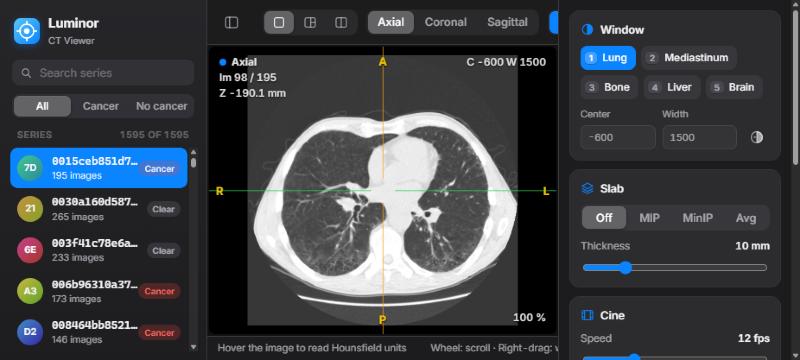
Luminor puts the seven things a radiologist does all day at the tip of a key: scroll, window, reformat, measure, project, compare and report. Fast, local and calm on the eyes.

Luminor showing the series library, an axial chest CT in lung window and the inspector with window presets

Seven features. One reading routine.

A radiologist reads 40 to 80 CT studies a day, and the same handful of actions make up nearly all of that work. Luminor was designed from that routine, starting with what a radiologist needs most.

01 · Scroll & cine

Scrolling is the reading.

In the reading room: most of a radiologist's time goes into scrolling through the stack, following a vessel, a bronchus or a nodule from image to image. If scrolling lags, nothing else matters.

  • The mouse wheel always scrolls, whatever tool is active. Shift moves five images at a time.
  • Cine playback at 2 to 40 images per second with Space.
  • Image number and slice position in millimetres always on screen.
WheelPrevious / next image Shift+ wheel: five images Page ↑↓Ten images Home / EndFirst / last image SpacePlay / pause cine
02 · Window & level

Every tissue, one key away.

In the reading room: every CT is read at least three times, in lung, soft-tissue and bone windows, and the window is adjusted dozens of times per study.

  • Right-drag anywhere for window and level, with any tool selected.
  • Presets on 1–5: lung, mediastinum, bone, liver, brain. They also work on AZERTY keyboards.
  • Exact centre and width entry, and invert with I.
1Lung · C −600 / W 1500 2Mediastinum · C 40 / W 400 3Bone · C 400 / W 1800 4Liver · C 60 / W 160 5Brain · C 40 / W 80
03 · Multiplanar reconstruction

Three planes, one point in space.

In the reading room: a finding is confirmed, measured and located in coronal and sagittal planes, not on axial images alone.

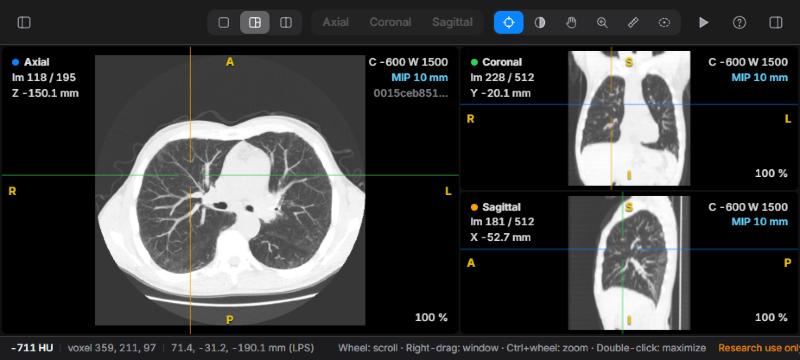
  • Coronal and sagittal views rebuilt with true physical proportions, head at the top.
  • Click with the crosshair to move all three planes to the same point.
  • Colour-coded planes and orientation letters calculated from the DICOM tags.
MPR layout with axial, coronal and sagittal panes and a coloured crosshair
04 · Measurements

Numbers you can report.

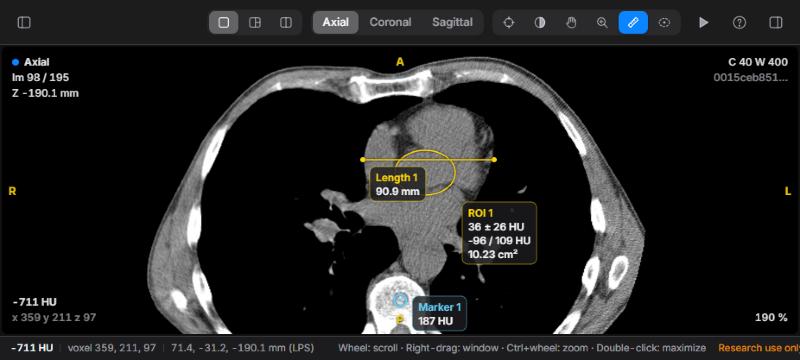
In the reading room: nodule size drives follow-up recommendations, and a lesion's density tells cyst from fat, soft tissue or calcium.

  • Live Hounsfield value under the cursor, with patient coordinates.
  • Distances in millimetres from the true pixel spacing, including on reformats.
  • Ellipse ROI with mean ± SD, min / max and area, computed on original images.
Length across the heart, an ellipse ROI with HU statistics and a marker on a vertebral body
05 · MIP & slabs

See the nodule, not the vessel.

In the reading room: maximum intensity projections make small nodules stand out from vessels; minimum intensity projections bring out airways and emphysema.

  • MIP, MinIP and average slabs from 2 to 40 mm, in every plane.
  • Cycle modes with T; adjust thickness with + / −.
  • Measurements always read the original voxels, never the projection.
MIPNodules, vessels, calcifications MinIPAirways, emphysema, air trapping AvgLower noise on thin images TCycle Off → MIP → MinIP → Avg
06 · Comparison

New, stable or growing?

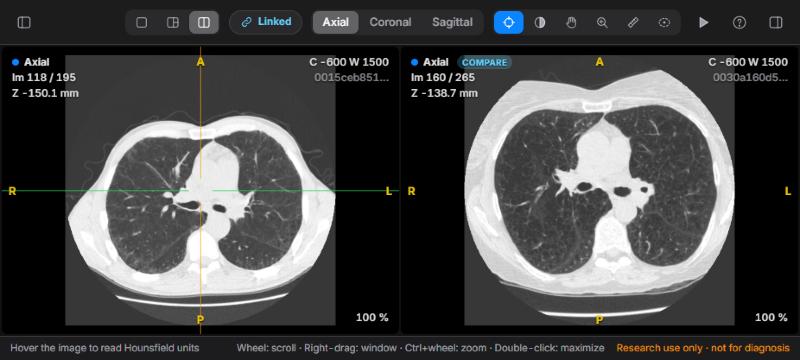
In the reading room: for a follow-up CT, the most important question is how today compares with the prior study.

  • Two studies side by side with the same window.
  • Scrolling linked in millimetres, even when slice spacing differs; zoom and pan mirrored.
  • Align once on a landmark with K, then read both together.
Two axial chest CT studies side by side in compare layout
07 · Findings & reports

From viewing to reporting.

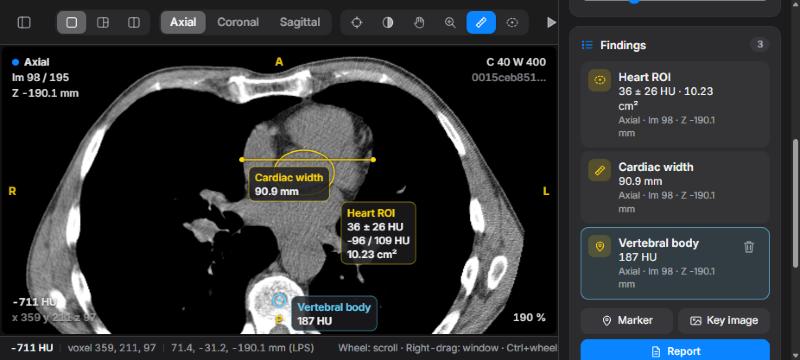
In the reading room: every finding needs a name, a value and a location that a colleague or a tumour board can find again.

  • Measurements and markers become named findings, saved automatically.
  • One click jumps back to any finding, in the right plane.
  • A Markdown report draft and annotated key images in PNG.
Findings list with a heart ROI, a cardiac width and a vertebral body marker

Get started

Luminor is a small Python server plus a browser app. It runs entirely on your computer.

1 · Install

Python 3.10+ with NumPy and pydicom.

git clone https://github.com/dhnguyends/luminor-dicom.git
cd luminor-dicom
pip install -r requirements.txt
2 · Point it at your scans

A folder with one sub-folder of .dcm files per CT series.

python server.py --data /path/to/series
3 · Read

Open the viewer in Chrome, Edge, Safari or Firefox, then press ? for shortcuts.

http://127.0.0.1:8770/

Sample data. Luminor was developed with chest CT scans from the Kaggle Data Science Bowl 2017. The dataset is not included: download it from the competition data page (Kaggle account and acceptance of the competition rules required), then run python server.py --data stage1 --labels stage1_labels.csv.

Documentation

An illustrated guide to every feature, with a suggested reading routine, an HU reference table and troubleshooting.

!

Research and education use only. Luminor is not a certified medical device and must not be used for diagnostic or treatment decisions.